For Clinical Labs
In today’s diagnostic landscape, laboratories must deliver fast, reliable, and cost-effective results despite staffing shortages, tighter regulations, and rising technical complexity.

When doing validations and verifications, we statistically estimate different performance characteristics of a method. The values gained by calculations never give exact information about the method under examination. So how can we know how trustworthy the results really are?
The standard tool for estimating the credibility of a statistical result is the confidence interval (CI), which describes the precision of an estimate. A wide confidence interval points to a lack of information, whether the result is statistically significant or not, and warns against over-interpreting results from small studies. Validation Manager calculates CI ranges for you automatically to help you in interpreting your results.
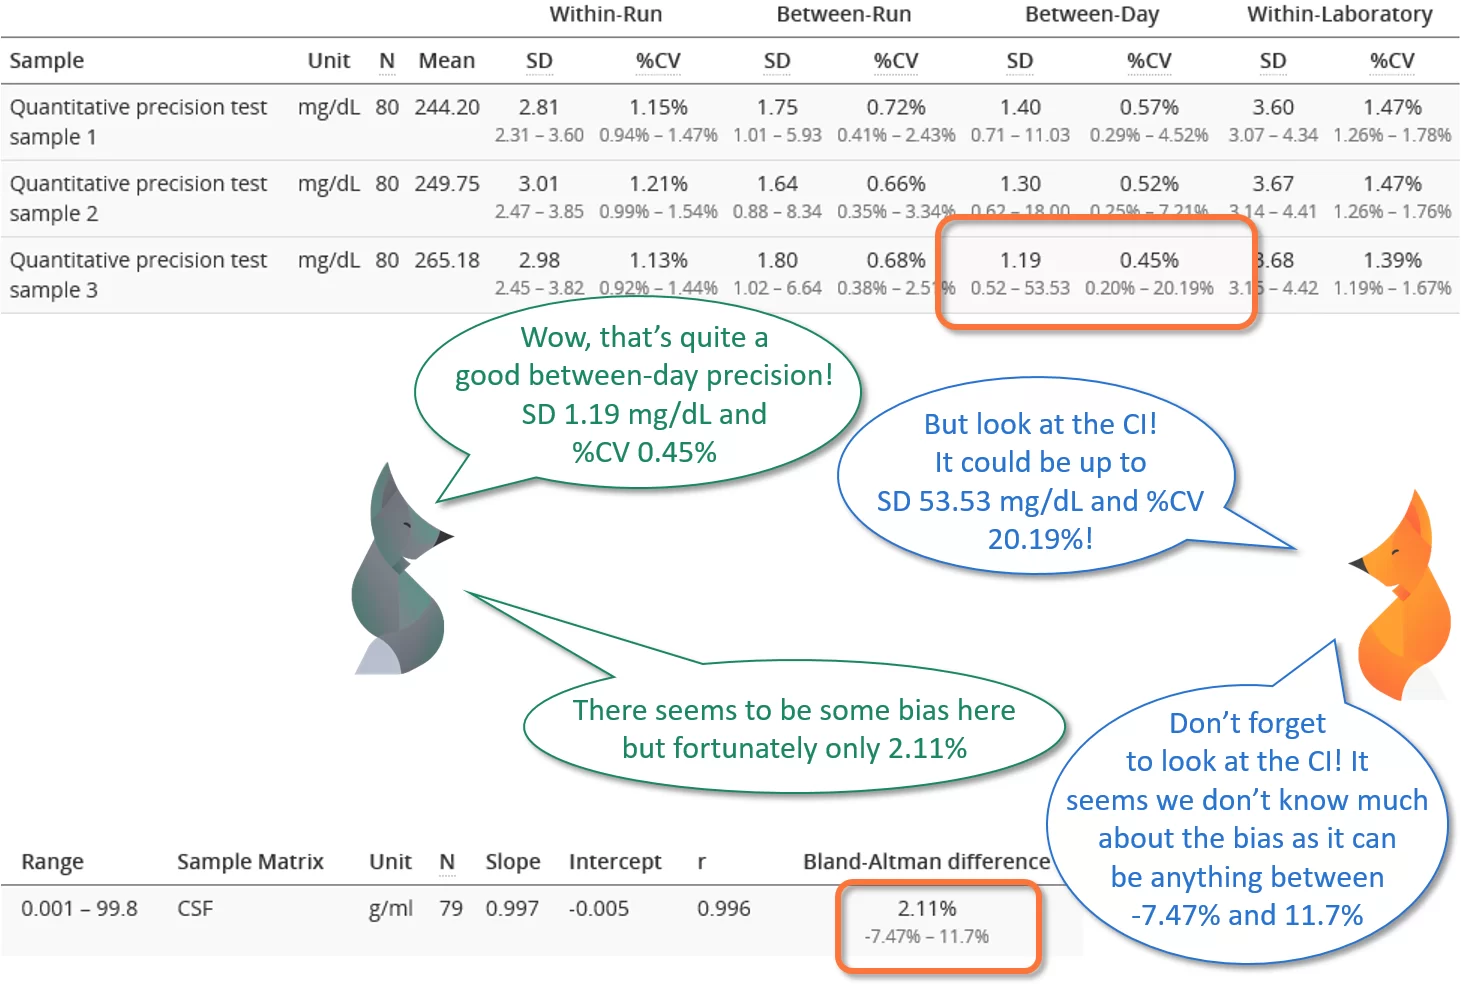
Image 1: Whenever the confidence interval is calculated, you should evaluate how it affects the reliability of your results.
In Validation Manager, we use a 95% confidence level for calculations, meaning that if you repeated your experiment 100 times, in 95 of those experiments, the true value would fall between the measured confidence intervals.
Probability describes a situation where we know the distribution (or basically the mean value and variance) of possible results from which we are taking individual data points to examination. When the distribution is known, we know the probabilities of each possible result.
Confidence level describes a situation where we do not know the true distribution. Even when we know the exact concentrations we are measuring, we don’t know the exact mean value of results given by the instrument because we don’t know the precise amount of bias given by our measurement setup. We estimate the distribution by collecting a statistically significant data set to represent the true distribution. It is possible (though rather unlikely, see xkcd comic 882) that our experiment yields such results that the measured CI does not give any information about the true value. Still, with a 95% confidence level, the true value lies within the measured confidence interval.
With a 95% confidence level, if you repeated your experiment 100 times, 95 times the true value would fall between the obtained CI.
With a 95% confidence level, if you repeated your experiment 100 times, 95 times the true value would fall between the obtained CI. In Image 2, the green, blue, and grey segments represent the confidence intervals of consecutive measurements, and the red arrow represents the true value of the quantity being measured.

Image 2: Example of confidence intervals that could be measured from the same sample.
Confidence interval is affected by the following components:
Image 3 visualizes how growing your sample size gives more confidence in your results. All the graphs show result distributions with different data sets of a population with a certain mean value and variance. When measuring a quantity, we measure only a subset of the possible results that could be obtained. Different subsets give different mean values as well as different confidence intervals. With a larger number of measurements, we can be more confident that the result distribution represents the measured quantity. This makes the confidence interval smaller, but our measurement still gives only an estimate of the value.

Image 3: Example graphs visualizing result distributions with different data sets of a population with a certain mean value and variance.
If you have a goal for achieving a specific value for a measured quantity (for example, if you are verifying an LoD claim of a test manufacturer), what can you conclude from your results?
CI gives you information about the credibility of the calculated value.
When comparing two quantitative methods or instruments with each other, we are interested in whether there is bias between the result. Again, we cannot only determine a value for bias by averaging over differences of individual samples, but we must also look at CI.
Please also note that bias is rarely constant over the whole measurement range. For example, small values may show negative bias, and large values show positive bias, as in Image 4. Sometimes part of the measurement range shows acceptable bias, and part of it shows unacceptable bias levels.
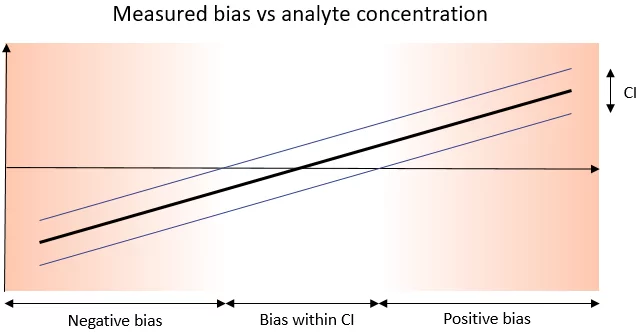
image 4: Example graph visualizing a situation where different concentration levels give different bias. The mean bias is small, but at the ends of the measurement range, the bias is unacceptable.
If you don’t have a stated goal for comparison, CI gives you information about the credibility of the calculated value. For example, if you measure precision with a 95% confidence level, the true precision in similar operating conditions lies within the CI. When evaluating whether the measured result is acceptable, you should consider the whole range given by CI, not only the calculated standard deviation or coefficient of variation. The true value can be anywhere within the CI, and you cannot state that some value within the CI would be more likely true than the others.
You could think of the calculated result a little bit like predicting when birth will start. The calculated value is the exact day when 40 weeks of pregnancy is completed, with a confidence interval extending from the 38th to the 42nd week. Most babies are born between 38 and 42 weeks, very few on the day when precisely 40 weeks have passed. So even though we like to operate with definite values, we must understand that they are only estimates and that the measured confidence interval represents the examined quantity better than any single value we may have as an estimate.
The confidence interval of the measured data represents the examined quantity better than any single value we may have as an estimate.
Unfortunately, there is no unambiguous answer to the question “when CI are acceptable.” As discussed in the previous section, CI gives knowledge whether your results are statistically significant, i.e., do you have a reason to state that a bias exists or that a goal has or has not been met. When the value you are is outside the measured CI, you can make these conclusions (with 95% confidence) regardless of the size of the CI.
When you don’t have a value to compare to, or the compared value falls within the measured CI, you need to consider whether the CI is acceptable or not. What is acceptable depends on what you are validating or verifying. The only universal thumb of rule is to look at the CI to make as pessimistic an interpretation as possible. For example, when establishing precision, you should consider the upper limit of CI as the true precision. When establishing bias, you should consider both the upper and lower limit of CI to evaluate whether this much uncertainty is acceptable or not. How likely would the differences between these outermost values affect how a patient is treated, and if they did, how dramatic could the consequences be? What ranges of results would give definite answers on a patient’s condition, and is that enough for clinical use? These are the profound questions guiding validations and verifications, and they need to be addressed case by case.
If you have doubts, growing the size of the sample population adds confidence.
References
Text originally published in , minor updates to contents on January 20, 2022